
There are several key performance indicators used to measure and track the performance and possible direction of the U.S. labor market. Typically, one metric will explain or reinforce the changes of another data point. However, data from the first quarter of this year still leaves many a bit uncertain about where the labor market is headed.
If you like the 30,000-foot view, here is a quick recap:
- Job growth is slowing
- Unemployment remains historically low
- Hiring levels remain mostly flat
- Job quits are holding at record levels
Having a bit of everything may be great for your morning bagel but when trying to forecast business growth and plan for your employment needs, mixed results aren’t always the most appealing. And cumulative reports don’t always match activity within individual industries.
In this quarterly report, we’ll review recent activity for the entire U.S. labor market along with a closer look at trends in the finance and professional business services industries. If you prefer to have this quarterly labor report delivered directly to your inbox, subscribe to our newsletter today.
United States Labor Market Activity
U.S. Job Growth
For months, the prevailing strategy by the Federal Reserve has been to raise interest rates to cool the labor market and tame inflation. However, the jobs report from the Bureau of Labor Statistics in January revealed a labor market that was still soaring with an initial increase of 517,000 new jobs.
Even after it was adjusted downward, in March and again last month, the revised number of 472,000 was still much higher than it had been in five months. Results for February (326,000 new jobs) and March (236,000) were more in line with predictions and the desired direction of those working to slow the U.S. economy. Both months were lower than the 6-month average gain of 334,000 new jobs.
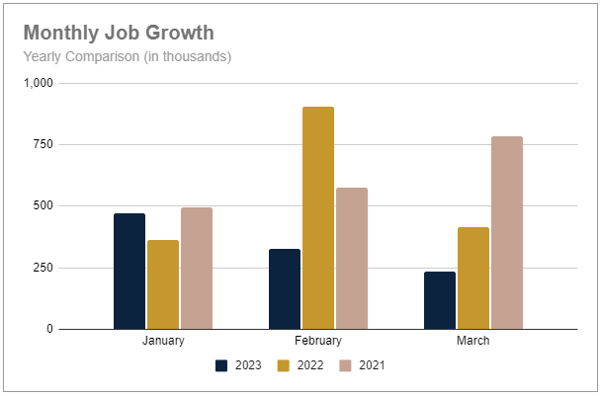
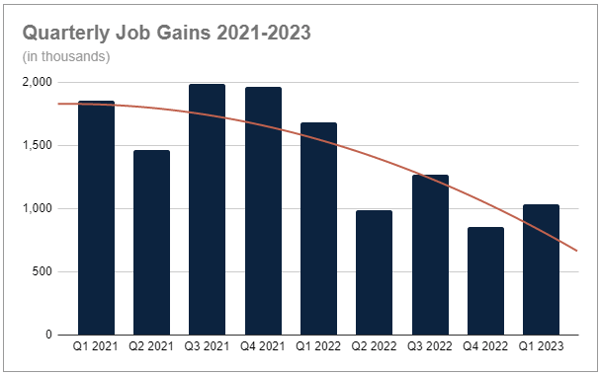
For Q1, just over 1 million jobs were added, a 21% increase over Q4, 2022, yet 38% behind the start of 2022 and 44% below Q1, 2021 when the labor market began picking up steam. Overall, the labor market has been slowing with quarterly gains roughly half of what they were in 2021 when employers were rapidly building back as pandemic restrictions were easing.
Concerns about a pending recession are still top of mind for most business leaders. However, finding and recruiting talent is right behind. Our survey revealed that most organizations plan to maintain their hiring plans for 2023, with others planning to increase hiring. (Only 1 in 5 respondents indicated plans to decrease hiring in 2023.)
U.S. Unemployment
The unemployment rate barely moved throughout the quarter, averaging just 3.5%. The last time the unemployment rate touched 4% was a year ago in January 2022. Participation rates have also held steady, ending the quarter at 62.6%. The metric has held at 62% or above since December 2021.
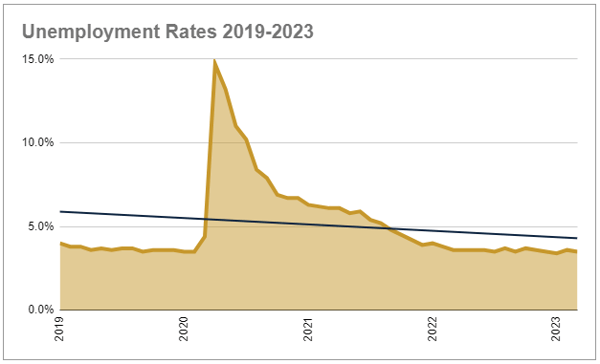
Considering the influx of layoff reports in recent months, you might expect these numbers to move in opposite directions. A clearer picture appears when individual industries are examined.
One area hit especially hard has been the Information Industry where layoffs increased by more than 400% between February 2022 and February 2023. Other industries with higher levels of layoffs were Construction and Retail which increased by 22% each, and Manufacturing which is up 15%. Combined, these industries account for 1.2 million employer-initiated job separations.
However, layoffs decreased by 25% in the same period in the Hospitality Industry, and by 10% in Professional and Business Services. Compared to a year earlier, these two industries had 99,000 fewer separations due to layoffs. While not an exact balance, stability in some industries has offset many of the losses in other industries.
Another factor in play is what some employees are choosing to do next after being let go. In January, The Census Bureau reported that 5 million new businesses were created in 2022 which was a 42% increase from pre-pandemic levels. These are new businesses that are also hiring displaced workers.
U.S. Hiring Trends
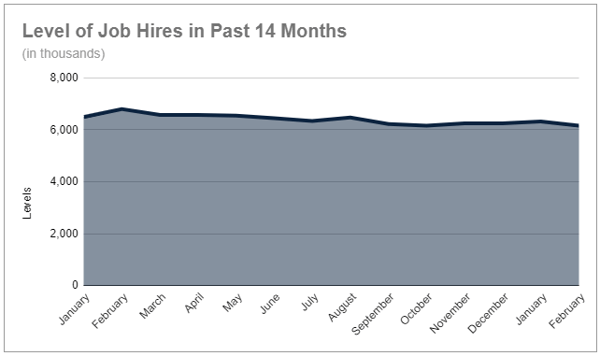
The volume of job hires across the U.S. ticked up slightly in January to more than 6.3 million hires before settling back again in February to under 6.2 million. The volume of hires has averaged around 6.2 million new hires over the past 6 months. The last surge of hiring came a year ago with 6.8 million hires in February 2022.
At the end of February, the total number of job openings decreased to 9.9 million, down just over 2 million openings from the peak last March. The last time job openings were below 10 million was in May 2021.
The number of jobs per unemployed person has also inched lower to 1.5 jobs. This too was down from a high of 2 jobs reached last year.
In the first two months of reported data this year, small businesses with 10-49 employees have posted the most job openings (3 million) and have made the most hires (2 million). Close behind are companies with 50-249 employees that reported 2.4 million openings and 1.7 million hires in February.
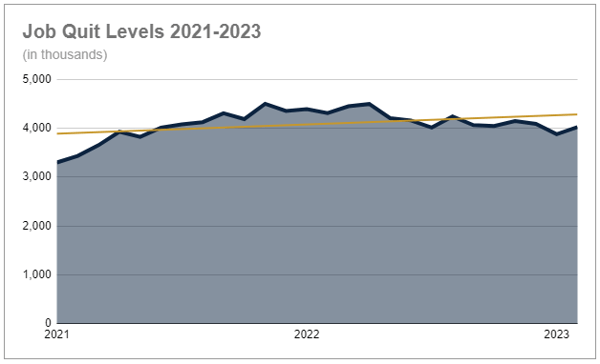
U.S. Job Quit Trends
There may be good reason organizations with less than 250 employees continue to lead the pace of hiring. These businesses also continue to post the highest levels of job quits with a combined total of 2.6 million, nearly 70% of the U.S. total.
The reasons for these quits may be just as varied as the companies these employees are coming from. A primary factor may simply be that other opportunities still provide good alternatives for employees to make a change. Currently, salaries still increase at a higher rate for those changing companies than for those receiving internal promotions. However, poaching competitor employees is certainly at play too. Yet, another reason brought to light after the pandemic was people simply leaving the labor market such as working parents, early retirements, and those deciding it was simply time to venture out on their own.
Job quits again reached 4.0 million employees in February, up from just under 3.9 million in January. Other than January of this year, quits have remained at or above 4 million for 21 months consecutive months.
Industry Employment Trends
Industry Job Growth
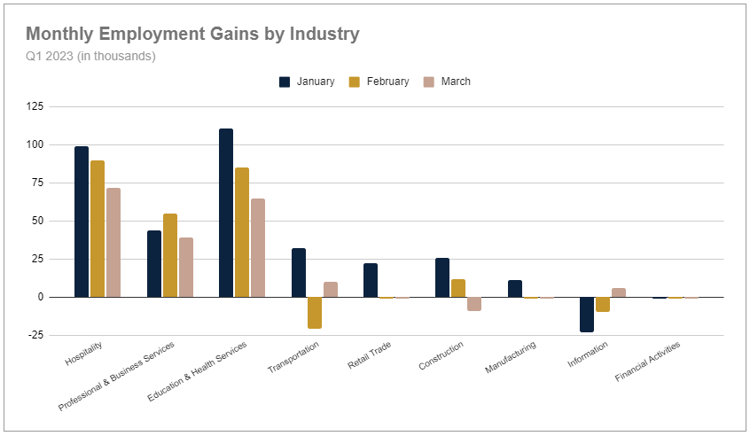
The strongest performing industries in the first quarter of this year were Hospitality, Professional and Business Services, and Education and Health Services with solid job gains each month. The other industries we closely watch had at least one month in the quarter with job losses or remained mostly flat. However, most industries had positive growth in January which drove the solid performance of the total labor market.
As expected, the largest decline was seen in Information with a net loss of 27,000 jobs. The decline was driven by businesses in Publishing, Broadcasting, Computing Infrastructure, and Telecommunications. Financial Activities also had a net loss of 3,000 jobs led by Banking, Insurance Carriers, and Real Estate organizations.
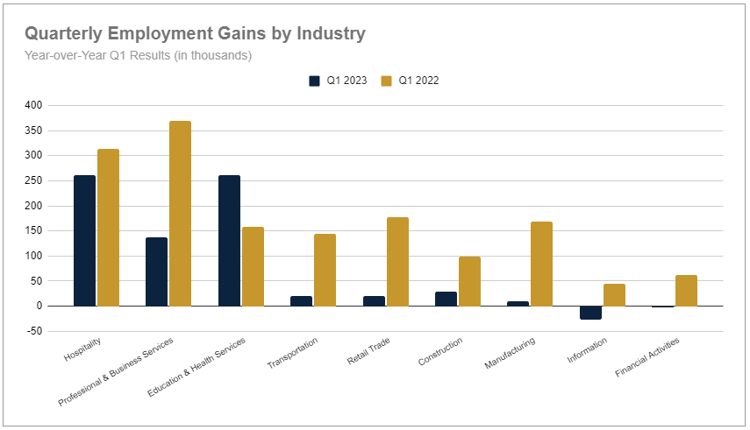
Only Education and Health Services had a stronger first quarter this year than in 2022, another indication of slowing job growth across the entire labor market.
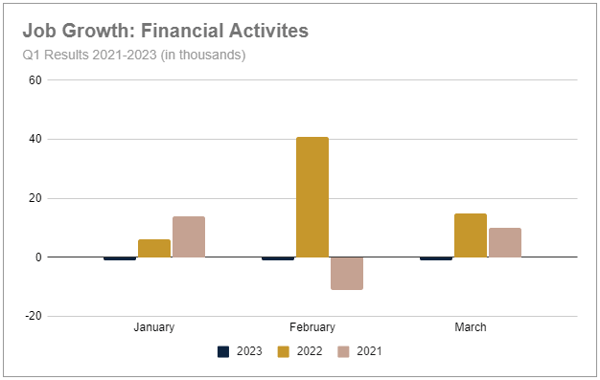
Financial Activities Industry
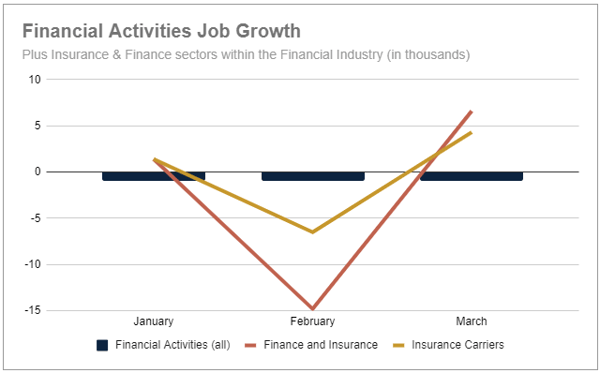
Organizations that fall under the Financial Activities Industry remained flat in Q1 with a collective loss of 1,000 jobs each month and by far, the worst start to a calendar year in some time. Due to the stellar growth posted in February of last year, Q1 2023 reported 65,000 fewer jobs compared to Q1 2022, and 16,000 fewer new jobs than Q1 2021.
Within this industry, two sectors we watch are Finance and Insurance and Insurance Carriers. While both remained mostly flat in January, each also posted notable job losses in February. Finance and Insurance was down 15,000 jobs with Insurance Carriers down 7,000.
Each sector did rebound in March with gains of 7,000 jobs for Finance and Insurance and 4,000 new jobs for Insurance Carriers. However, those modest increases were not enough to pull either sector into a positive position at the end of Q1.
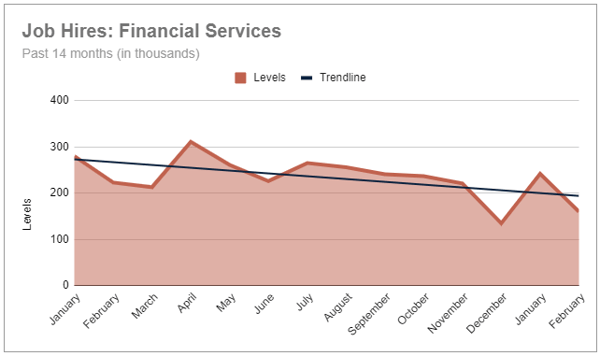
Over the past 14 months job hires within Financial Services continues to trend downward despite periodic spikes of increased activity. December 2022 and February 2023 were the only two months during this period with total hires for the industry below 200,000.
Businesses in this industry made 242,000 hires in January with another 160,000 hires in February, these totals are 20% lower than at the beginning of 2022.
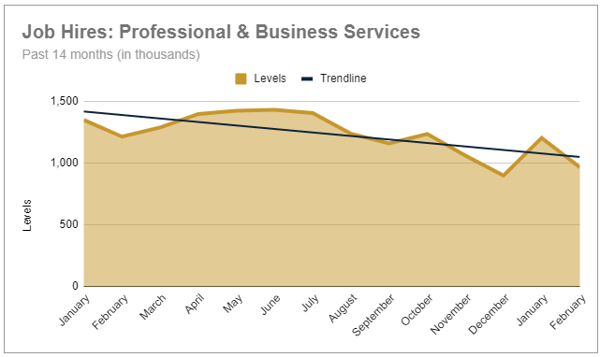
Professional and Business Services Industry
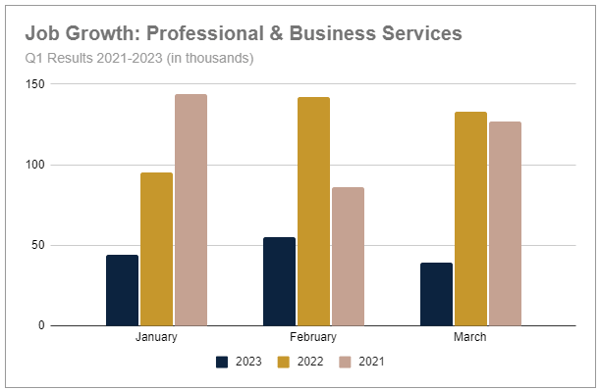
Professional and Business Services had respectable gains each month of the first quarter for a total gain of 138,000 new jobs. The strongest month was February with 55,000 jobs. However, these results were 63% behind last year’s early gains in Q1 and 61% behind the start of 2021. While this industry was only one of three that ended the quarter with positive gains each month, growth for these businesses was roughly half that of businesses in the Hospitality or Education and Health Services for the quarter.
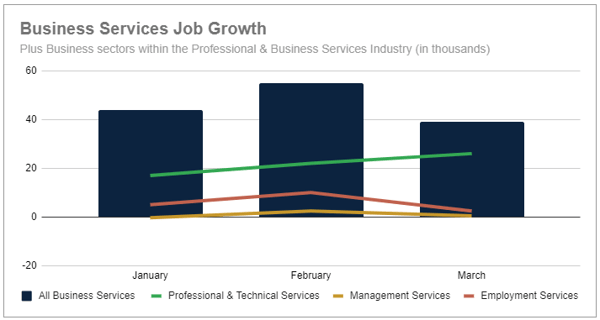
Within this industry, Professional and Technical Services was the driver contributing 47% of total quarterly gains with 65,000 new jobs in Q1. Management Services was flat with only a modest increase of 2,000 jobs in February. Businesses within Employment Services also posted its best month in February but with gains made in the other months as well, this sector added a total of 17,000 jobs for the quarter.
Hires within this industry have also been trending downward over the past 14 months. Similar to Financial Services, there was a small increase to 1.2 million hires in January before sliding to just under 1 million hires in February, just ahead of December 2022 totals.
This industry begins the year 15% behind the volume of hires made in the first two months of 2022.
A Final Perspective
After a prolonged period of surging job growth and frenzied hiring patterns, a slowing labor market may give businesses a moment to catch their breaths, take a step back, and evaluate their recruitment process. Hiring at a more controlled pace allows organizations to review and refine their employment needs, set clear hiring strategies, and define their ideal hires.
However, the mixed results of the first quarter also indicate that employees still have plenty of options and opportunities available, thanks to low unemployment levels. And the consistently high level of job quits indicates they aren’t afraid of doing so, even if those changes mean venturing out on their own or entering a new phase of their lives. The message to organizations remains, don’t lose sight of your efforts to build and support employee engagement.
What questions and concerns do you have about building and supporting your team? We’re here to help.
.png)


.png?width=217&height=217&name=Best%20%26%20Brightest%20Inc.%205000%20(2).png)