
A year has passed since the economy came to an abrupt and jolting stop, and the U.S. Labor Market is now telling a completely different story. This news can give us plenty to breathe a collective sigh of relief about. Yet for as many glimpses of the end-of-tunnel light we are seeing, there are still many indications the United States economy has a long road to a full economic recovery ahead of us. The Wall Street Journal reported that there are over 9 million Americans struggling to find jobs they want, and yet companies are collectively reporting they have over 9 million openings they cannot fill.
The reasons for the disconnect, the Journal explains, include workers have moved to areas where jobs aren’t as available, changing employment preferences (such as the ability to work from home), the shifting economy that now favors jobs and industries where there are fewer workers with the needed skills, and benefits to unemployed or underemployed workers that has allowed them to be more selective of what roles they pursue next.
Yet in areas where employment rates are improving, not all industries are experiencing the same level of resurgence as some have seemed to regress from small forward strides. Frustratingly, further growth in most areas seems to be moving at a pace hard to identify and at a stride that often feels like we’re standing still.
For organizations that are in a cycle of growth and rebuilding, it’s time to brush up on your interviewing skills. However, if your organization is strategically holding back, focus on employee morale and keeping employee turnover as low as possible.
U.S. Labor Market Activity
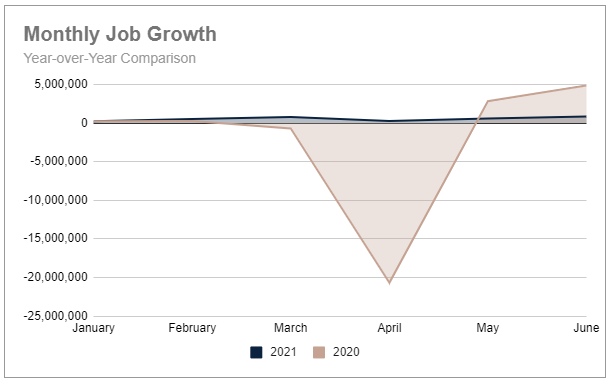
United States Job Growth
The second quarter of this year began with a very rocky start when economists optimistically set their targets on seeing one million new jobs added to the labor market in April. Posting a very disappointing 27% of that goal left many scrambling for answers as to why. As the quarter progressed, the U.S. Labor Market responded with some of the strongest monthly numbers of the year so far. In May 583,000 new jobs were added, a 117% increase over the disappointing 269,000 reported in April. The number jumped again in June with 850,000 more new jobs, up 46% for the month.
For the quarter this was a total of 1.7 million new jobs representing a 9.5% increase over Q1 2021 results. A much more optimistic picture than what 2020 painted. Just a year ago, the U.S. Labor Market was down 13 million jobs at the end of the second quarter when the brutal effects of the pandemic hit the economy hardest. However, as optimistic as this sounds, job creation for both May and June were well below what they were last year, down 79% and 82% respectively. Halfway through 2021, the U.S. Labor Market has only recaptured 25% of the total jobs lost in 2020.
 Source: U.S. Bureau of Labor Statistics
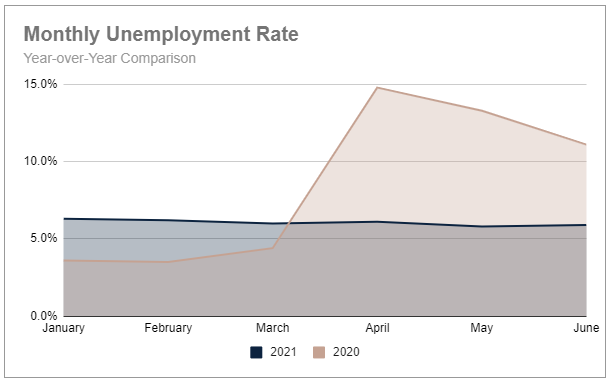
United States Unemployment Rate: Q2, 2021
Depending on your perspective, the unemployment rate is doing well, holding relatively even for the first half of this year, or it has been painstakingly slow at improving to pre-pandemic levels. From April to June, the unemployment rate only declined by two-tenths of a percentage point, 6.1% to 5.9%. (May was the lowest level this calendar year so far at 5.8%.) In the first quarter, the unemployment rate was at an average of 6.2%, improving to an average rate of 5.9% in Q2.
 Source: U.S. Bureau of Labor Statistics
We can all safely agree it has vastly improved over 2020 though when the unemployment rate over the second quarter ranged from almost 15% in April to just over 11% in June. This was also at the height of the economic impacts of the pandemic. However, it has also taken nine months to drop a full percentage point (unemployment was at 6.9% last October) and is still well above the 2019 yearly average of just 3.7%.
One reason for the very slow decline is that as more jobs are added to the economy, stimulus packages are ending, and fear over the spread of the virus wanes, more people are again entering the workforce and seeking employment opportunities increasing the pool of job seekers.
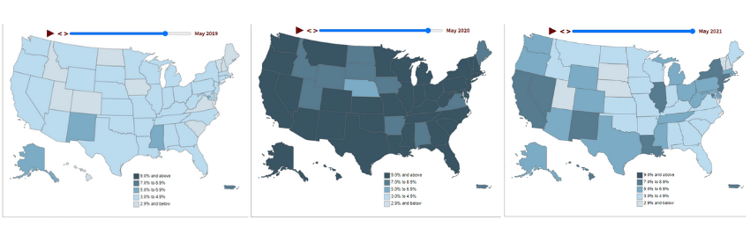
This graphic illustrates the changes in each state’s unemployment rate over the past three years: pre-, during, and post-pandemic.
 Source: U.S. Bureau of Labor Statistics
Job Growth in the Business & Professional Services Sector
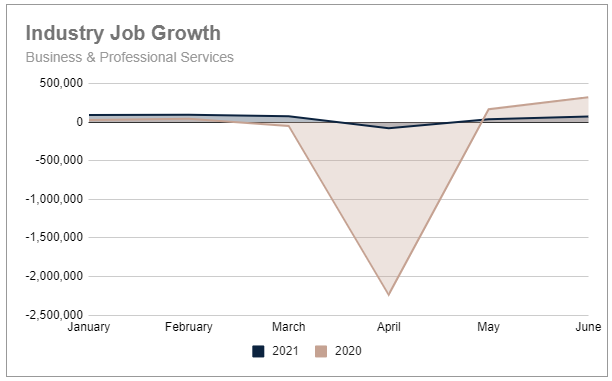
April was a harsh month for the Business & Professional Services sector as well with a collective loss of 81,000 jobs. The U.S. Bureau of Labor Statistics reported this was driven by temporary help services that lost 111,000 jobs in April.
Gains in May and June helped to overcome the early losses last quarter with 36,000 and 72,000 new jobs added, respectively. Yet, at a total for the past three months of just 27,000, this is just 9.5% of new jobs posted year-to-date. The first quarter gained 257,000 new jobs.
The numbers offer a little brighter picture when total year-to-date numbers are considered. Since January, the Business & Professional Services sector has added 286,000 new jobs, a 116% increase over the same period last year.
 Source: U.S. Bureau of Labor Statistics
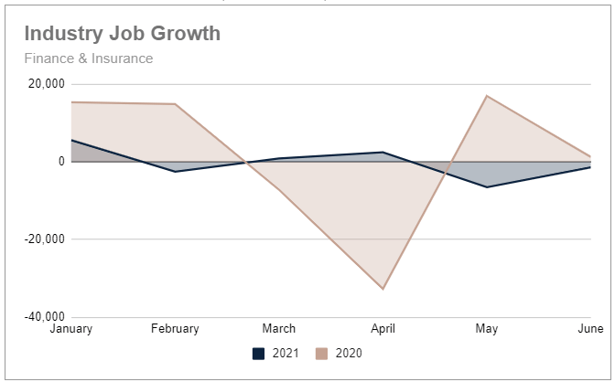
Job Growth in the Finance & Insurance Sector
Business & Professional Services isn’t the only sector to see its share of ups and downs in new jobs this year. The Finance & Insurance sector is seeing its own set of challenges with any small gains met with slightly higher losses.
In the first quarter of this year, a total of 4,000 new jobs were added thanks to gains made in January and again in March. In the second quarter, the 2,500 new jobs added to the sector in April were quickly erased by a loss of 6,500 jobs in May and another loss of 1,400 jobs in June. Meaning for the year, the Finance & Insurance sector is down a total of 1,400 jobs or 116%. Narrowing in on just the insurance subsector, new job growth is down 150% for the first half of 2021 compared to 2020.
 Source: U.S. Bureau of Labor Statistics
Considering that the insurance industry is a stable and growing part of our business, these metrics caught us a bit off guard. What’s going on and why doesn’t it seem to coincide with what we and some of our clients are experiencing?
There are a couple of reasons that apply to all industry sectors the BLS reports on. First, the U.S. Bureau of Labor Statistics reports on industry trends across the entire country when detailing total new job gains and losses. A statistical average for the U.S. cannot account for the fact that the job market for finance and insurance professionals in New Mexico is not going to look or behave the same as it might in Michigan.
Second, each sector and even subsectors, contain a variety of related yet different business types. In this case, the Finance and Insurance industry group falls under the larger Financial Activities industry, and consists of two subsectors: Insurance Carriers, and Agencies, Brokerages, and other Insurance related activities. So what insurance carriers specifically are experiencing (such as acquisitions and added automation) may not reveal the same results as what agencies and brokerages are experiencing.
For example, The Bureau of Labor Statistics was still forecasting (as of April, 2021) that the job outlook for Insurance Sales Agents would increase by 5% between 2019 and 2029. All other occupations in total are projected to grow by 4% in the same period, and by just 3% for other sales roles. While sales agents are just one role within the broader category, it serves as a good bellwether for the brokerage industry in general.
In addition, each business knows that whatever growth or stagnation they are going through doesn’t always mean their competitors are doing the same thing or at the same time. If you haven’t worked with us before, these differences also explain why we are so diligent about getting to know you and your organization before we start a hiring process with a new client.
U.S. Hiring Trends
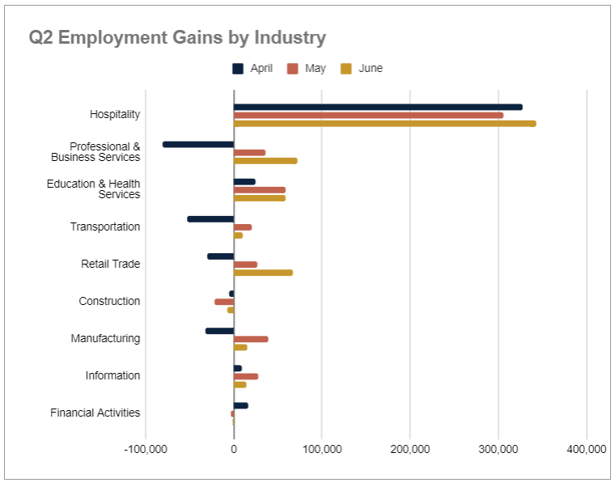
Q2 Industry Employment Trends
Taking a broader view of the U.S. Labor Market, the Hospitality industry continues to dominate in job creation. Education & Health Services and Information Services were the only other industries to have positive gains each month of the quarter. Conversely, only the Construction industry had losses each month of the quarter.
In the industries with a mix of gains and losses throughout the quarter, Profession & Business Services, Transportation, Retail, and Manufacturing all followed the pattern of job losses in April, followed by gains in both May and June. However, the broader Financial Activities sector reported the exact opposite with gains in April and losses in the remaining months.
 Source: U.S. Bureau of Labor Statistics
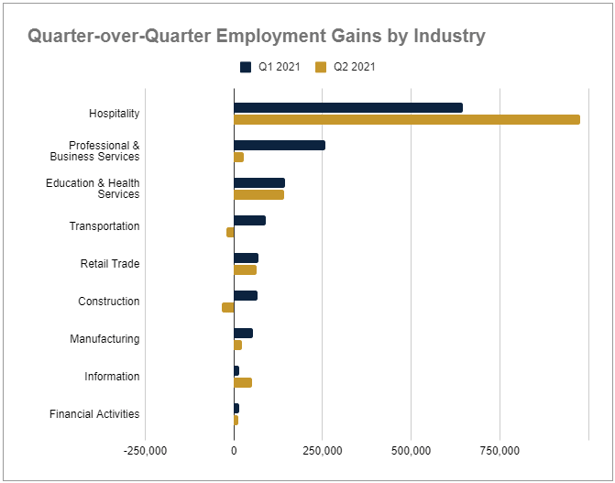
Year-to-Date Industry Employment Trends
Quarter-over-Quarter, the Hospitality and Information Services industries realized more new jobs in the second quarter than the first. Education & Health, Retail, and Financial Activities were nearly even between the quarters. Professional & Business Services, Transportation, and Construction had weaker second quarters, with only Transportation and Construction reporting quarterly losses.
 Source: U.S. Bureau of Labor Statistics
Did you know you can receive these quarterly labor market summary reports delivered right to your inbox? Subscribe to our quarterly newsletter today!

.png)


.png?width=217&height=217&name=Best%20%26%20Brightest%20Inc.%205000%20(2).png)