
Perspective has an interesting way of shaping impressions. If you just pick up on reports of sweeping layoffs between various media outlets and your social feeds on certain days, it can certainly feel like the U.S. economy is headed straight into a recession. Even just considering the job reports from the last three months can make you feel a bit uneasy.
So take a step back and look a little wider. Various media reports are also sharing record-level profits while personal announcements of new jobs and careers continue to fill social pages. Can both be accurate?
They indeed can be. It all depends on your perspective.
The volume of new jobs added to the U.S. Labor Market has decreased in the past four months compared to the preceding months. However, we have seen some record months (in both directions) since early 2020. Expand your view out a bit more and this past quarter’s results seem on the stronger side of “normal”.
And if a recession is looming, companies have chosen to ignore the chatter with their continued high rate of successful hires that have remained at over 6 million each month since the beginning of last year. Of course, part of the continued aggressive hiring pattern has been the levels of job quits that also remain at record levels.
Keep reading as we dive into second quarter labor trends from a variety of perspectives.
U.S. Labor Market Activity
United States Job Growth
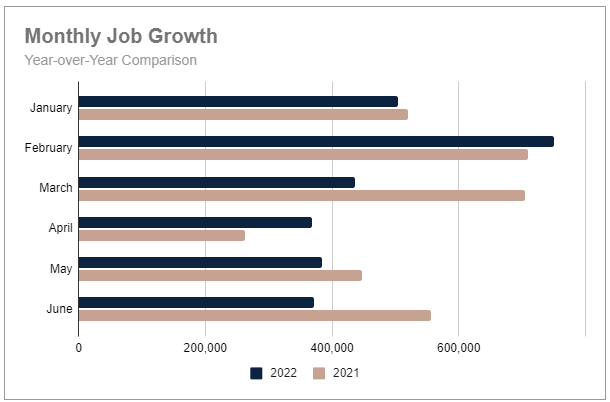
Job growth remained fairly stable throughout the second quarter of this year with an average gain of 375,000 new jobs each month. The other consistent aspect was a 33.5% decrease from first quarter results, similar to last year when gains declined by 34% in the second quarter.
Year-over-year, job growth is down 11.3% compared to Q2 2021. Just two months so far this year, February and April, posted higher monthly numbers than in 2021.
Last year employers were laser-focused on building back what they had lost during the pandemic shutdowns that hit the U.S. economy and labor market hard. This year, growth has remained strong but seems to be more calculated and strategic in finding the right talent, especially with increasing inflation concerns and growing speculation of a possible recession.
For the first half of 2022, job growth is about 12% behind last year’s pace with an average of 469,000 jobs each month compared to almost 562,000 in 2021. The slower pace has also pushed the longer trend from a positive, upward direction in the second half of last year, to a nearly flat trend at the beginning of this year, to now a clear downward slope entering the second half of 2022.
Yet, despite job growth slowing, April’s gains of 368,000 jobs was the lowest figure reported since April of 2021 when 263,000 jobs were added.
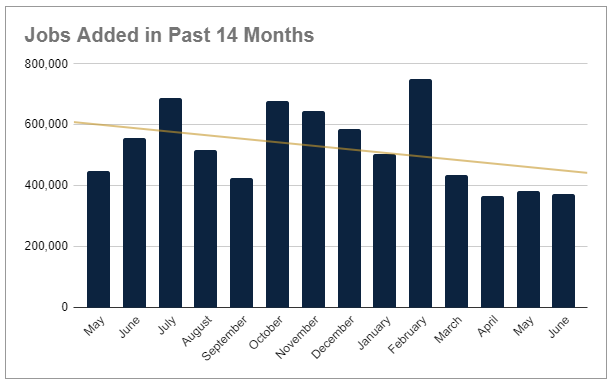
Unlike the past 12-14 months when external factors centered on rebuilding from the impacts of the pandemic, multiple influences are now potentially at play. The second half of this year will likely reveal how various industries, sectors, and organizations interpret the economic, political, and international dynamics that could impact individual businesses.
United States Unemployment Rate
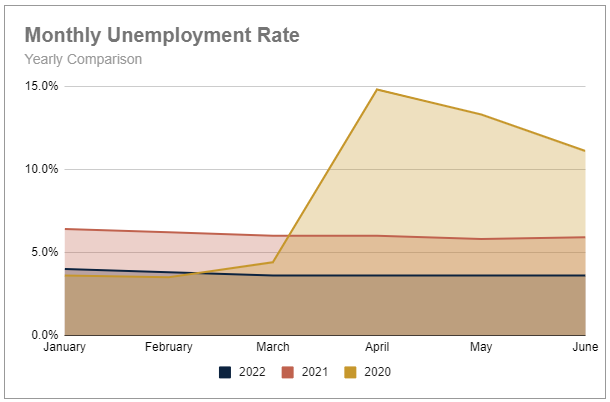
The unemployment rate held at a steady 3.6% for a fourth straight month. Considering the growing number of reports of various organizations initiating layoffs, this is incredibly positive news.
Last year the unemployment rate hovered just under 6% in the second quarter, almost double this year. And it was two years ago when unemployment suddenly skyrocketed to 14.8% at the highest point in April 2020, four times the current level.
The unemployment rate in Professional and Business Services ended the quarter at 3.4%, almost two points below where it was one year ago. The Financial Activities industry continues to hold one of the lowest unemployment rates at just 2.1%, more than one point below June 2021.
Mining (which includes oil and gas extraction) had the lowest rate at 1.6%, while the Hospitality industry reported the highest unemployment rate at 5.2%.
Industry Employment Trends
Year-to-Date Industry Employment Trends
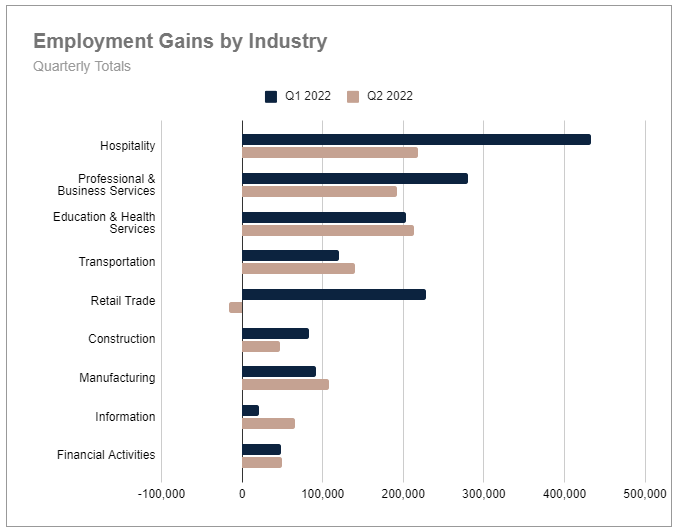
When the majority of the industries post positive job gains throughout the quarter, the outliers become very noticeable. Starting with Retail Trade, this industry started the quarter with 12,300 new jobs in April before posting a loss of nearly 44,000 jobs in May. The quarter ended well with the addition of more than 15,000 in June. However, the challenges mid-quarter left his industry with a quarterly loss of 16,000 jobs.
These losses were driven largely by general merchandise stores (down 33,500 jobs in May). However, clothing (-8,200), food & beverage (-7,700), and health & personal care (-5,200) retailers also played a contributing role with declines in May.
The Construction industry started completely flat at the beginning of the quarter with zero gains in April before posting better gains in May and June led by nonresidential specialty trade contractors. General construction for both residential and nonresidential continues to struggle though.
The third industry to experience some dips throughout the second quarter was Financial Activities, which is a very broad industry including sectors ranging from banking, credit, and securities to insurance to real estate. Job losses throughout the second quarter were driven by the credit intermediation and commercial banking sectors.
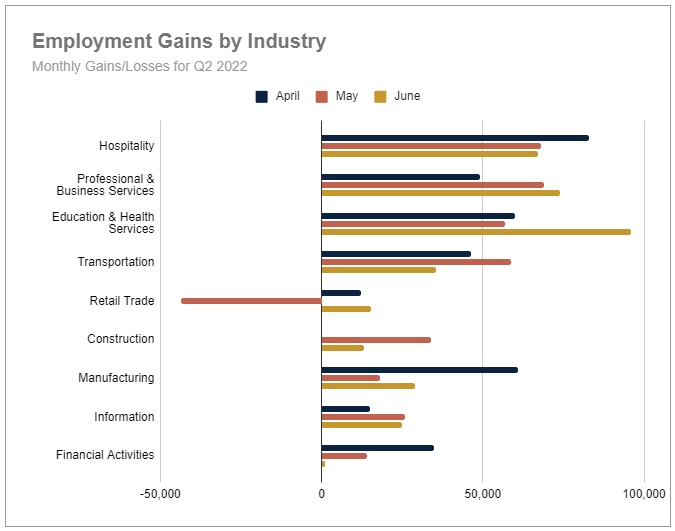
Quarter-over-quarter Education & Health Services, Transportation, and Manufacturing all saw increased job gains in Q2. The Financial Activities industry held mostly even. Hospitality, Professional & Business Services, and Construction had weaker gains in the second quarter. Only Retail Trade has shown a loss in job creation for the first half of this year.
Job Growth in the Business & Professional Services Industry
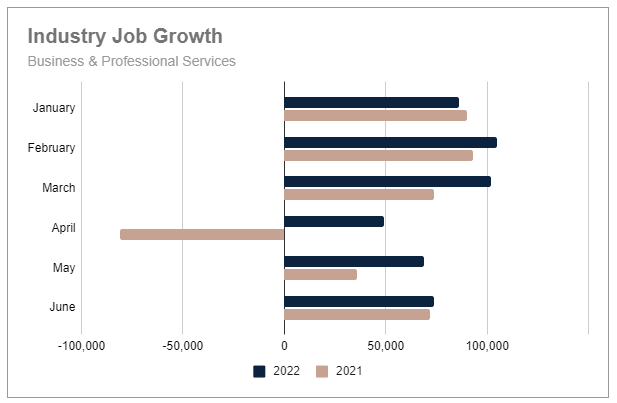
Business and Professional Services reported solid gains each month of the second quarter, although not nearly as strong a performance as the first quarter. The quarter started with just 49,000 new jobs in April. This was a 52% drop from March. However, a vast improvement year-over-year when this industry lost 81,000 jobs in April 2021.
May saw another 69,000 new jobs, a 41% increase for the month, and a 92% year-over-year increase.
June numbers improved again with a 7% month-over-month increase (+74,000 jobs) to end the quarter. This was just slightly ahead of last year (+3%) as well.
For the quarter, job gains are down 34% compared to Q1. However, total gains are up 611% compared to Q2 2021. Year-to-date job gains in the Business & Professional Services industry are up 71% over last year.
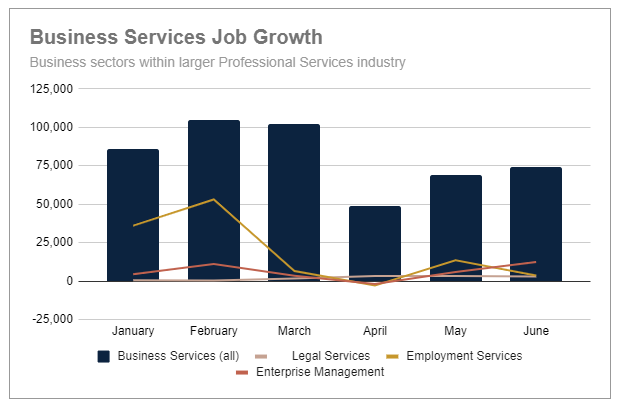
Diving a bit deeper into this industry, Legal Services had consistent gains in Q2 with 3,000 or more new jobs added each month to end the quarter 165% ahead of Q1.
Employment services didn’t fare nearly as well starting the quarter with a loss of 2,800 jobs in April. This sector did rebound in May with 13,600 more jobs but slowed again in June with only 3,600. Overall this group was down 85% compared to the first quarter.
The Enterprise Management sector also started Q2 with a loss of 1,800 jobs before adding 5,900 in May and a solid 12,400 in June, ending the second quarter 14% behind Q1 numbers.
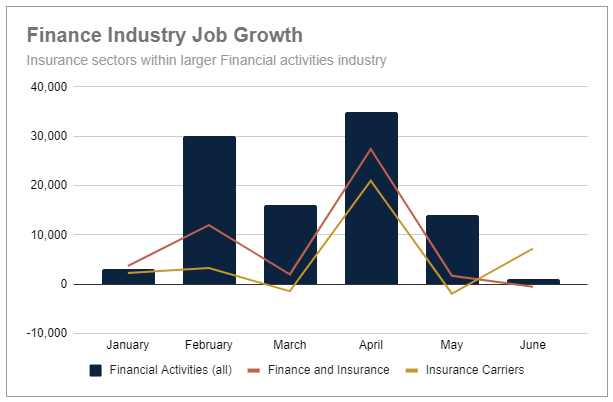
Job Growth in the Finance & Insurance Sector
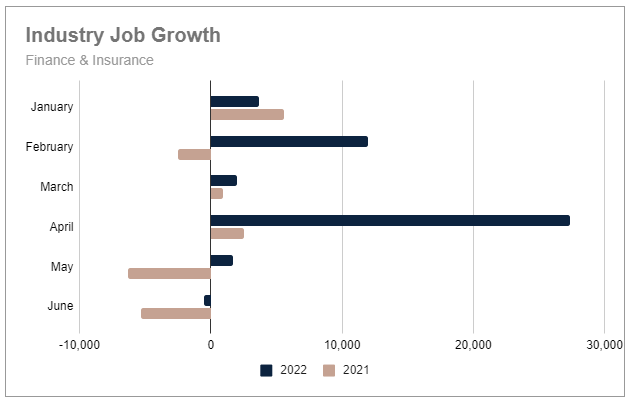
The Finance and Insurance sector (a subset of the Financial Activities industry) posted their best monthly job gains for the year so far in April with 27,400 new jobs. This was a 1270% increase over March and a 996% increase year-over-year.
Unfortunately, these gains were short-lived with only 1,700 new jobs in May followed by a loss of 500 jobs in June. Yet, these numbers were still much better than a year ago when this sector lost 6,300 and 5,300 jobs in May and June 2021, respectively.
Compared to Q1, second quarter gains were up 62% for the Finance and Insurance sector. This was also a repeat of impressive year-over-year improvements at 1007% over Q2 2021. Year-to-date, this industry segment has already surpassed the total jobs added in 2021. (46,300 in 2022 so far compared to 35,700 new jobs in 2021.)
As a whole, the Financial Activities industry continued the yo-yo style of monthly job gains with 35,000 new jobs in April (+119% for the month) followed by just 14,000 more jobs in May and only 1,000 in June. The second quarter was nearly even with the first quarter at 50,000 in Q2 compared to 49,000 new jobs in Q1.
In a similar fashion to the Finance and Insurance sector, Insurance Carriers reported 21,000 new jobs in April. This was a 1600% increase for the month. However, the sector lost 1,900 jobs in May before adding 7,200 in June. For the quarter, this was a 526% increase over Q1.
This chart compares the Finance & Insurance and Insurance Carriers sectors against the larger Financial Activities Industry.
U.S. Hiring Trends
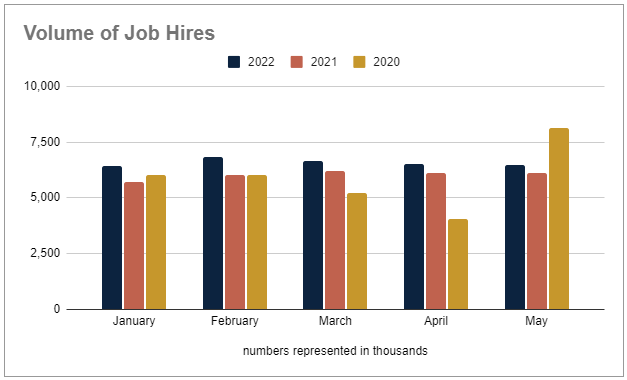
Despite threats of a recession and reports of hiring freezes and layoffs in some sectors, the labor market remains highly competitive for top talent. At the end of May, the Bureau of Labor Statistics reported nearly 11.3 million open jobs in the United States. Still nearly two available jobs for every unemployed person.
The participation rate that has remained just above 62% since January has allowed companies to increase their hiring momentum. The hiring rate is now almost fourteen times faster than the pace of job creation. In the first five months of this year, almost 33 million open jobs were filled compared to the 2.4 million jobs created.
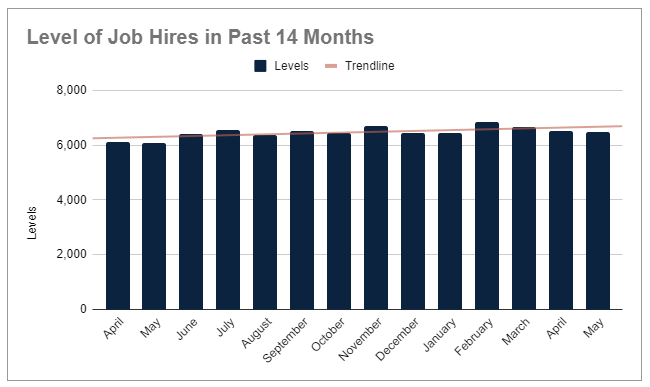
The pace of hiring has only slowed marginally since March, and is still above 2021 levels for the same period. Hiring in the first five months of this year outpaced 2021 levels (30,200) by 9% and 2020 levels (29,400) by almost 12%.
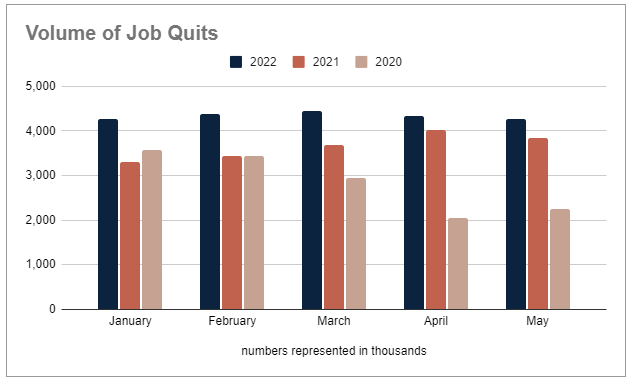
Job Quit Trends
One of the biggest questions persists though, are quit rates still at record high levels? Unfortunately, yes.
March posted the highest level yet at more than 4.4 million workers (2.9% of the U.S. workforce). In May, the BLS reported the level of quits had decreased slightly to just under 4.3 million workers (2.8%).
For the year, (January through May) a total of 21.6 million workers have quit their jobs. If that number seems staggering, it should. This is 18.5% above 2021 levels (18,300), and 52% above 2020 (14,300) for the same five-month period.
A Final Perspective
Regardless of the size of your organization and the reach of your customer base, business today operates in an interconnected global marketplace. What happens in one area has ripple effects that will impact other areas. The only question is, how much?
Supply chains, weather, economic conditions, politics, and on the list goes. This makes things exciting and incredibly challenging at the same time. And unfortunately, no one can find that crystal ball into the future yet.
Our best advice is to focus on retaining the top talent you already have with solid employee development plans that include detailed career paths for their future. Then review your hiring process to ensure you can move from open position to first-day introductions as quickly and seamlessly as possible.
Of course, partnering with the right talent acquisition team can make a substantial difference too. Access our recruitment guide below for an inside review of our industry and ways we can help you reach your talent-based goals.
Get this quarterly labor report delivered directly to your inbox. Subscribe to our newsletter today.
.png)


.png?width=217&height=217&name=Best%20%26%20Brightest%20Inc.%205000%20(2).png)