
New job postings have done a near 180° turn from what happened last year. This should give all of us, regardless of industry, reason to be optimistic again. Organizations hire when they feel confident about the future and have growth plans in place.
The cautious side of us though knows that increased demand for talented individuals means candidates have greater choice in job selection. Nice for candidates making a career change, but challenging for companies that need to compete for their attention and commitment. This also means employers need to be clearer about what they have to offer prospective employees and manage their expectations about a potential increase in the time to hire.
U.S. Labor Market Activity
United States Job Growth
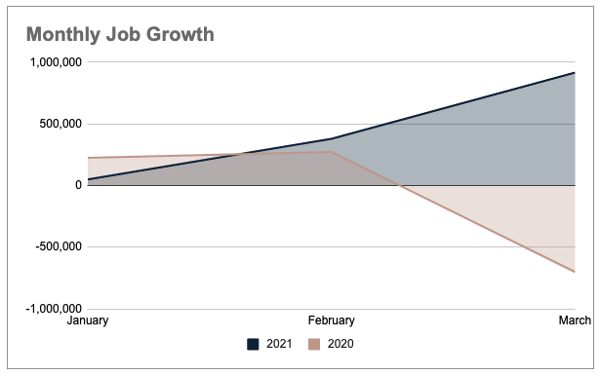
In the first quarter of this year, 1.34 millions new jobs were added to the labor market. Compared to the first quarter of 2020, this was an 862% increase. Last year, new job growth was fairly even across January and February, and had been seeing gradual increases for much of 2019. And then came March of 2020 when all bets were suddenly off. At the end of Q1, 2020 the U.S. labor market had a net loss of 203,000 jobs.
New job creation for the beginning of 2021 looks substantially different. January had a slow start with 49,000 new openings, however February kicked the labor market off with a 673% month-over-month gain and 379,000 jobs added. The solid increase continued last month with March revealing 916,000 more new jobs added, a 142% gain over February and a 1,769% gain over January.
 data source: Hireology, U.S. Bureau of Labor Statistics
United States Unemployment Rate: Q1, 2021
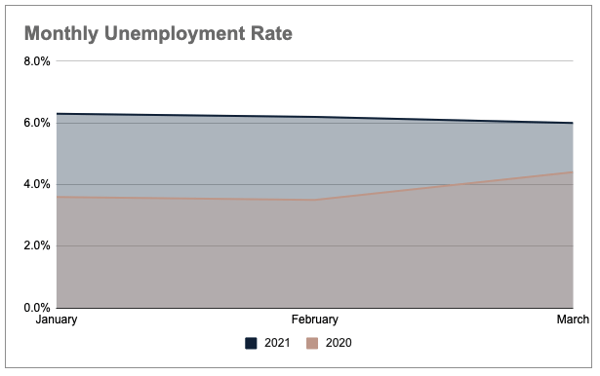
The national unemployment rate has been declining throughout this quarter, but the decreases have been painstakingly small with a drop of just .3% from January to March. The average unemployment rate for Q1, 2020 was only 3.83%, meaning the U.S. is a solid 61% above where we were last year at this time when the economy and jobs market were just realizing the full impact of the pandemic.
 data source: Hireology, U.S. Bureau of Labor Statistics
Job Growth in the Business & Professional Services Sector
This quarter we will focus our industry segment on the Business and Professional Services. The data we are seeing in this sector is rather mixed.
The first thing to notice is that this industry nearly mirrored the activity of the entire U.S. labor market in 2020. However 2021 looks substantially different.
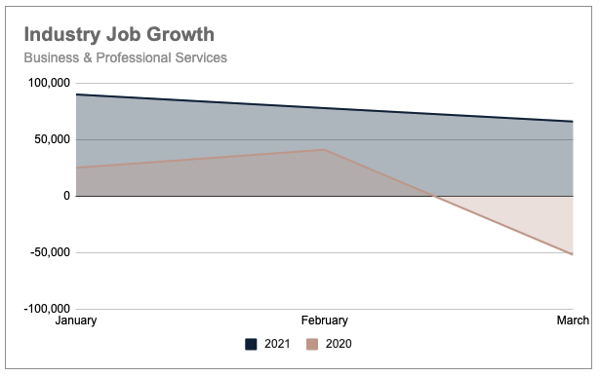
This year started well above where 2020 started for this sector, unlike the total U.S. job market that began noticeably below 2020 levels. However, while much stronger than last year, new job postings for the Business and Professional Services sector have been trending downward over the quarter.
In Q1 2021, the Business and Professional Services sector added 234,000 jobs to the U.S. marketplace (17% of the total volume). This was a 1,571% increase over 2020 when there was only a net gain of 14,000 new jobs in the sector. These are fantastic numbers.
Of concern is that throughout Q1 of this year, the number of new jobs in this sector has been declining each month. February’s total of 78,000 jobs was 13% less than January (90,000 new jobs). And March declined by 15% at just 66,000. Collectively the volume of newly created jobs in the Business and Professional Services sector reduced by 27% from January to March.
 data source: Hireology, U.S. Bureau of Labor Statistics
So what does the downward trend from this last quarter mean for companies working in this business sector? Honestly, it could be nothing but a slight dip that will look relatively flat when we look back in December. However, this also could be a good time for hiring organizations to re-evaluate their hiring strategies.
Follow us here for a moment. Over the last quarter there has been a surge in new job postings while postings in Business and Professional Services are slightly declining. Unless there is also an increase of new talent into the labor pool, there will be tighter competition between hiring companies for that talent. This means candidates may ask and expect more from prospective employers.
One way companies can combat this is to get creative with their talent acquisition strategies. Consider transferable skills from closely related fields where you can discover top talent that may not have the same high demand as you. The growing number of individuals who have now perfected remote work, could also mean finding someone in a region with a lower cost of living or even someone willing to trade a bit on compensation in return for increased flexibility.
U.S. Hiring Trends
Top Hiring Industries
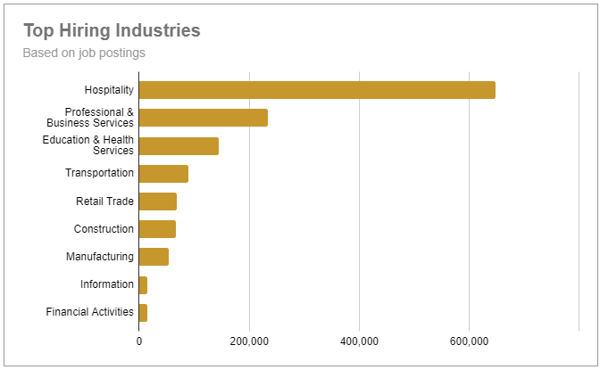
The top 3 hiring industries last quarter were Hospitality, Professional and Business Services, and Education and Health Services. Over the last 3 months 647,000 new jobs were added in the Leisure and Hospitality sector. These gains were 176% more than the next fasting growing segment (Professional and Business services) and very encouraging considering that the 12-month average is still down almost 2.4 million jobs.
Professional and Business Services added a solid 234,000 new jobs but this sector is still battling a 12-month average that had declined by 534,000 jobs. Education and Health Services added 144,000 more jobs last quarter. This industry sector is also facing a challenging recovery, with the 12-month average here down 954,000 jobs.
Not surprisingly, over the past 12 months, service providing industries lost a collective 6.1 million jobs in the United States. However there is plenty of optimism. In just the last 3 months, 1.5 million service providing jobs have been added into the labor market. This number jumps to nearly 1.9 million new jobs when viewed over the past 6 months.
 data source: U.S. Bureau of Labor Statistics
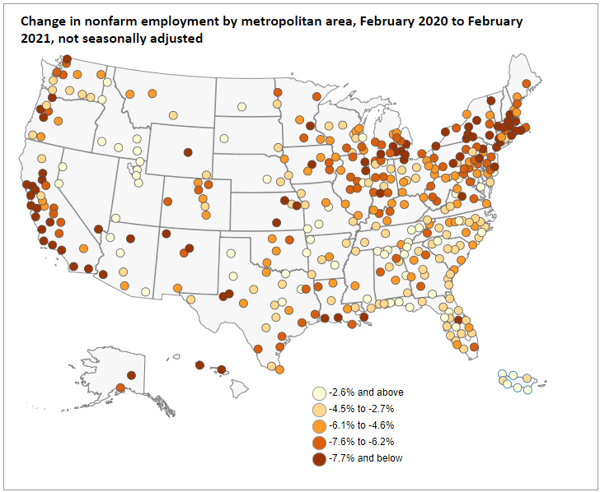
Year-Over-Year Geographic Employment Trends
Year-over-year employment levels reveal areas of expected slow recovery, like the east and west coasts that were hit especially hard with the pandemic. However there are also areas that should encourage us, such as Idaho, Utah, and much of the southeast.
Metropolitan areas with some of the largest year-over-year deficits include:
- Kahului, HI (-26.2%)
- Odessa, TX (-17.9%)
- Las Vegas, NV (-13.8%)
- Santa Cruz, CA (-13.4%)
- Santa Fe, NM (-12.4%)
And just some of the areas leading the way with the highest year-over-year gains include:
- Ocean City, NJ (+11.9%)
- St. George, UT (+4.3%)
- Idaho Falls, ID (+4%)
- San German, PR (+3.6%)
- Lakeland, FL (+1.3%)
Other areas show the diversity of the industries in their state when Orlando’s unemployment rate is down 12.5% year-over-year compared to surrounding metro areas that range from only down 4% (The Villages) to slightly ahead (Lakeland).
 data source: U.S. Bureau of Labor Statistics
Did you know you can receive these quarterly labor market summary reports delivered right to your inbox? Subscribe to our quarterly newsletter today!

.png)


.png?width=217&height=217&name=Best%20%26%20Brightest%20Inc.%205000%20(2).png)